Hack
Nuclide has been built from the start to provide a great IDE experience for Hack development. Hack is a programming language for HHVM.
Currently, HHVM is not supported on Windows, so this integration has limited viability on that platform. However, work is being done to port HHVM to Windows.
Installing Hack
In order to fully use the integration of Hack, you must have both Hack and HHVM installed on your system:
- Install HHVM. By default, Hack is installed with HHVM.
- If you are new to Hack, HHVM’s Getting Started provides steps for writing your first Hack program. The
key items of note are:
- The typechecker
hh_clientis in your$PATHenvironment variable (the default install of HHVM, should place it there). - You have an
.hhconfigfile at the root of your project. - You have
<?hhat the top of your.phpor.hhfile.
- The typechecker
If you are planning on developing with Hack remotely, ensure HHVM and Hack are installed on the remote machine.
Features
Hack’s integration into Nuclide provides you with productivity features such as:
- Code Diagnostics
- Autocomplete
- Jump to Definition
- Inline (mouseover) type hinting
- Code formatting
- OmniSearch, with a special Hack symbol search pane.
Code Diagnostics
If your code doesn’t correctly typecheck, Nuclide has code diagnostics that will show you the error. You can see the error in two places, inline within the Editing Area and in the Code Diagnostics pane below.
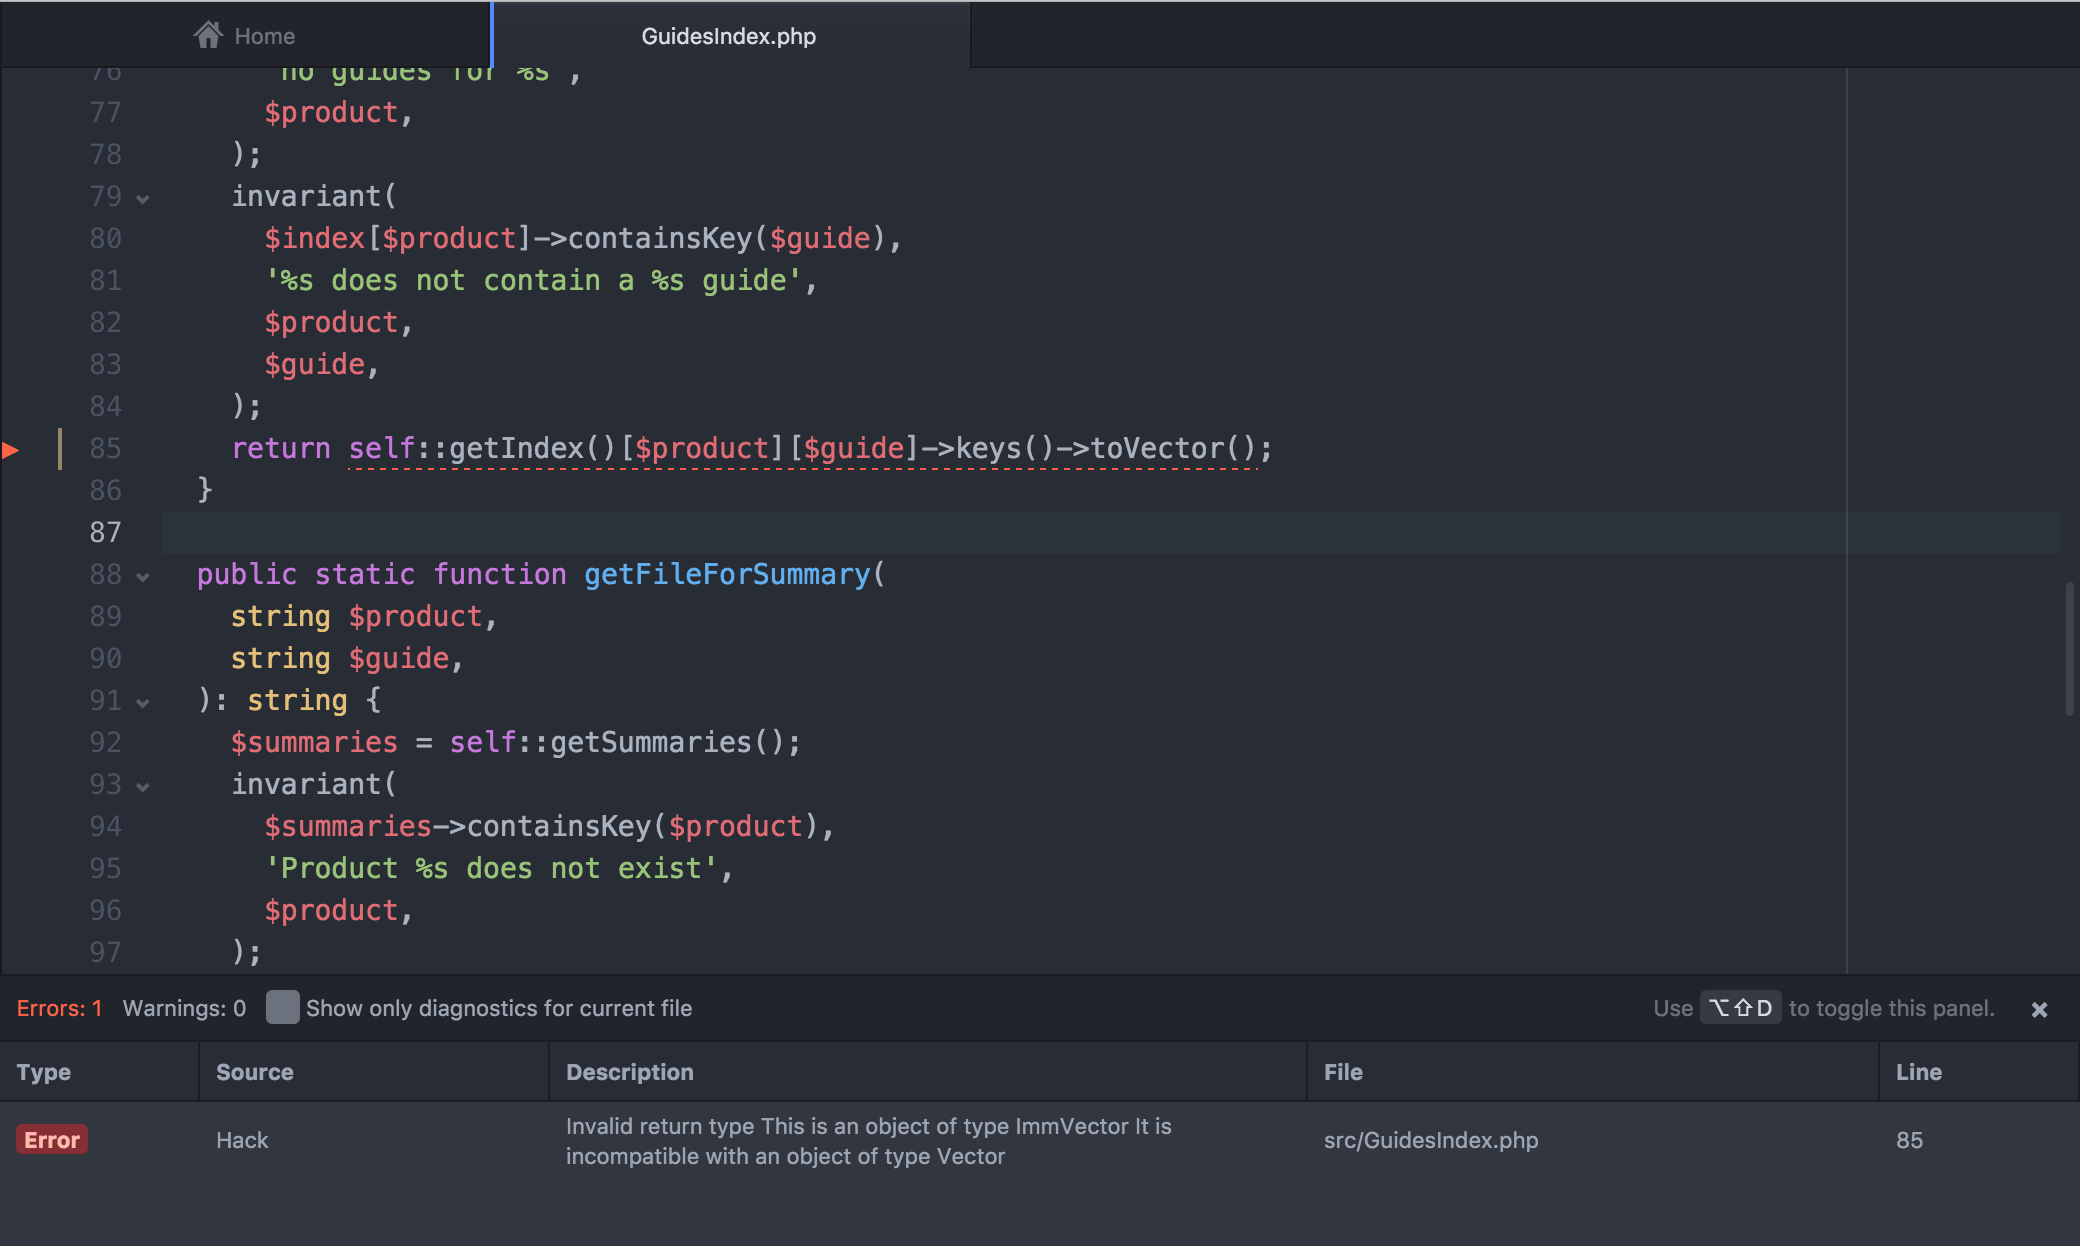
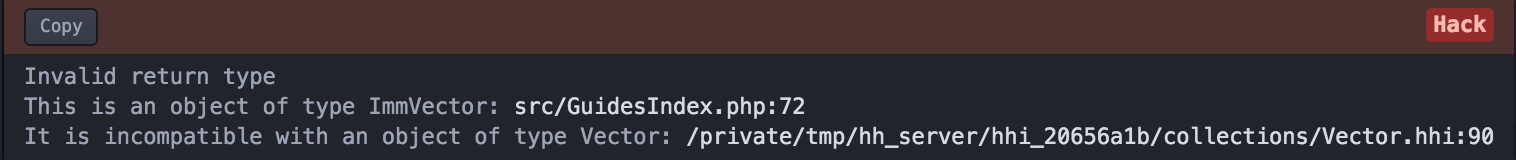
Hover over the sideways red triangle in the gutter to see the Hack error inline.
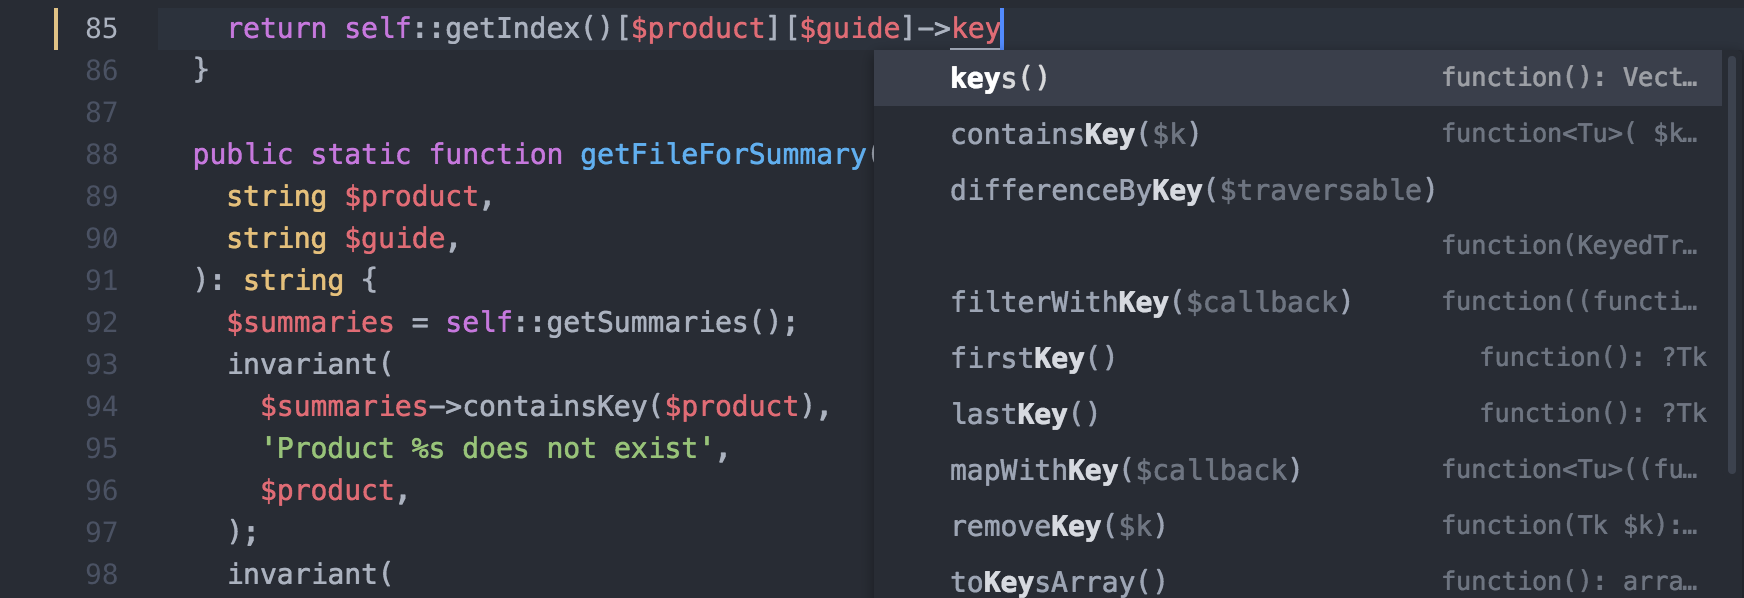
Autocomplete
Given that Nuclide has access to all of the type information within your project and the built-in types provided by Hack, autocomplete just works.
Jump to Definition
Nuclide provides a jump to definition/symbol feature for Hack programs.
In order for this to work, you must have an
.hhconfigfile in the root of your project and a runninghh_servermonitoring the root as well.
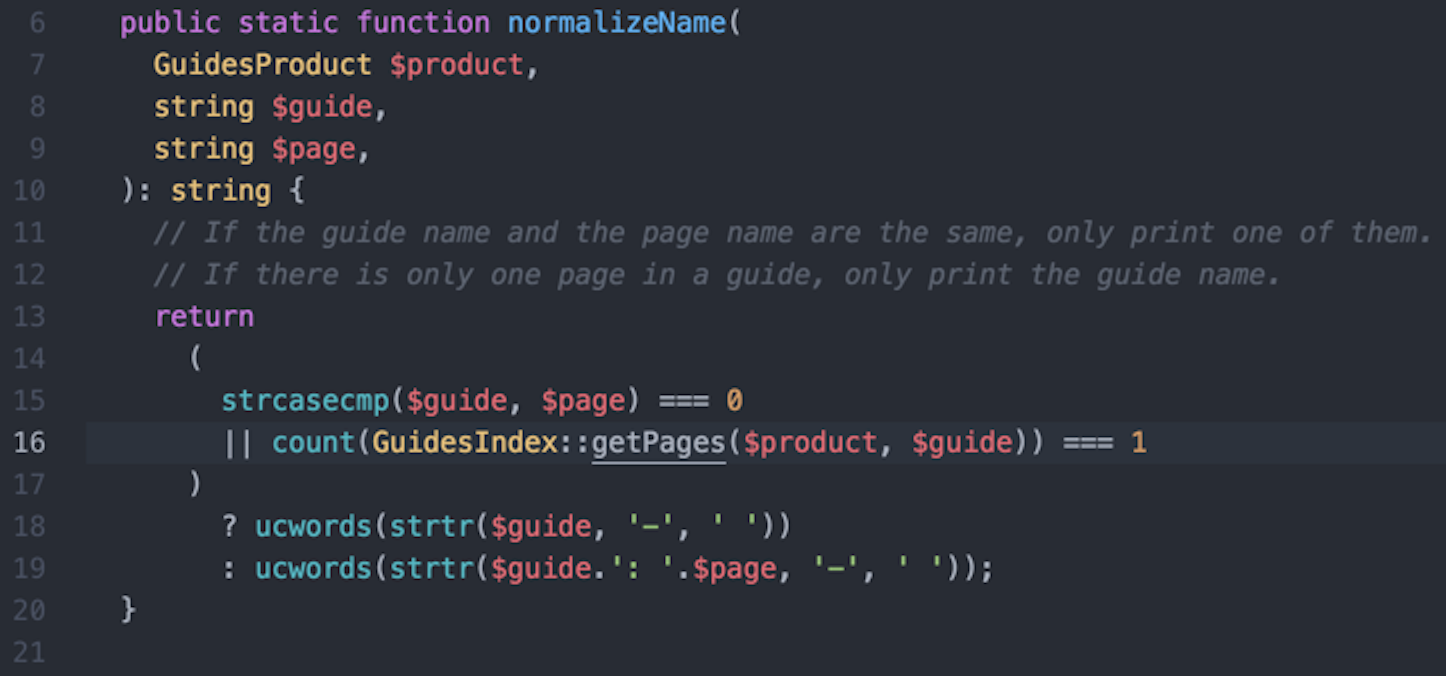
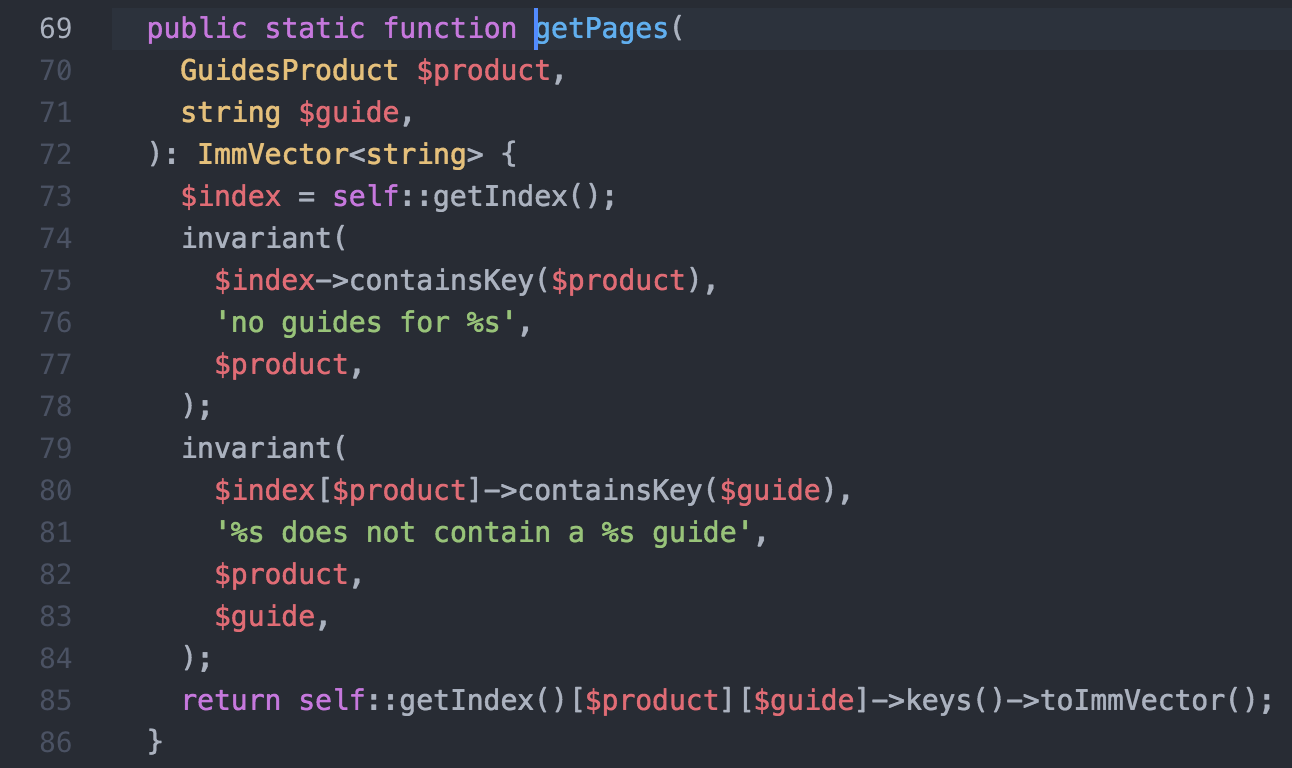
For example, if you want to go to the definition of getPages(), hover over getPages()
and either press Cmd-<mouse click> or Cmd-Option-Enter (Ctrl-Alt-Enter on Linux).
Type Hinting
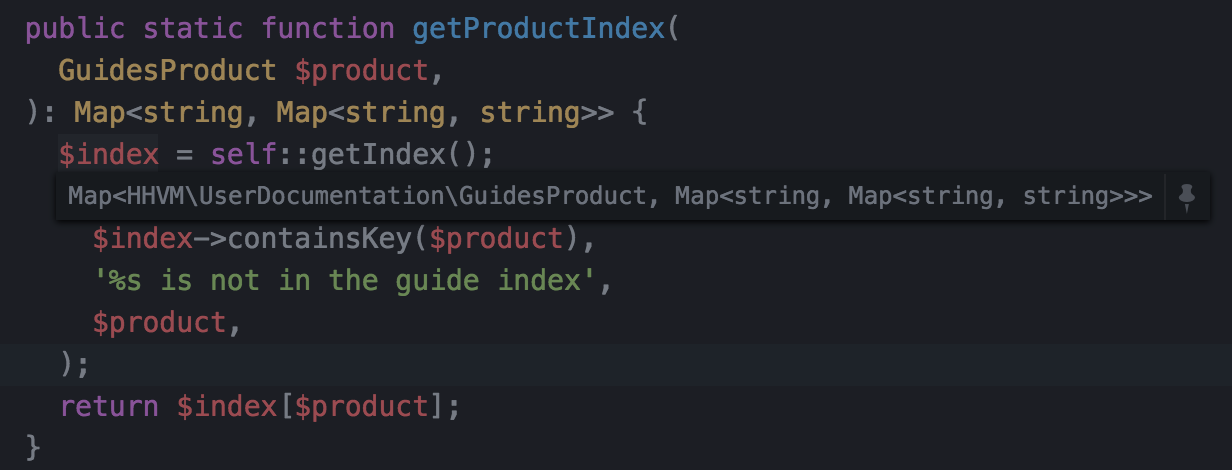
If you hover over a variable in your Hack file, you can get the type of the variable directly inline.
In fact, you can even pin that type hint so that it always displays. Just click on the pin icon when hovering over a variable to pin it.
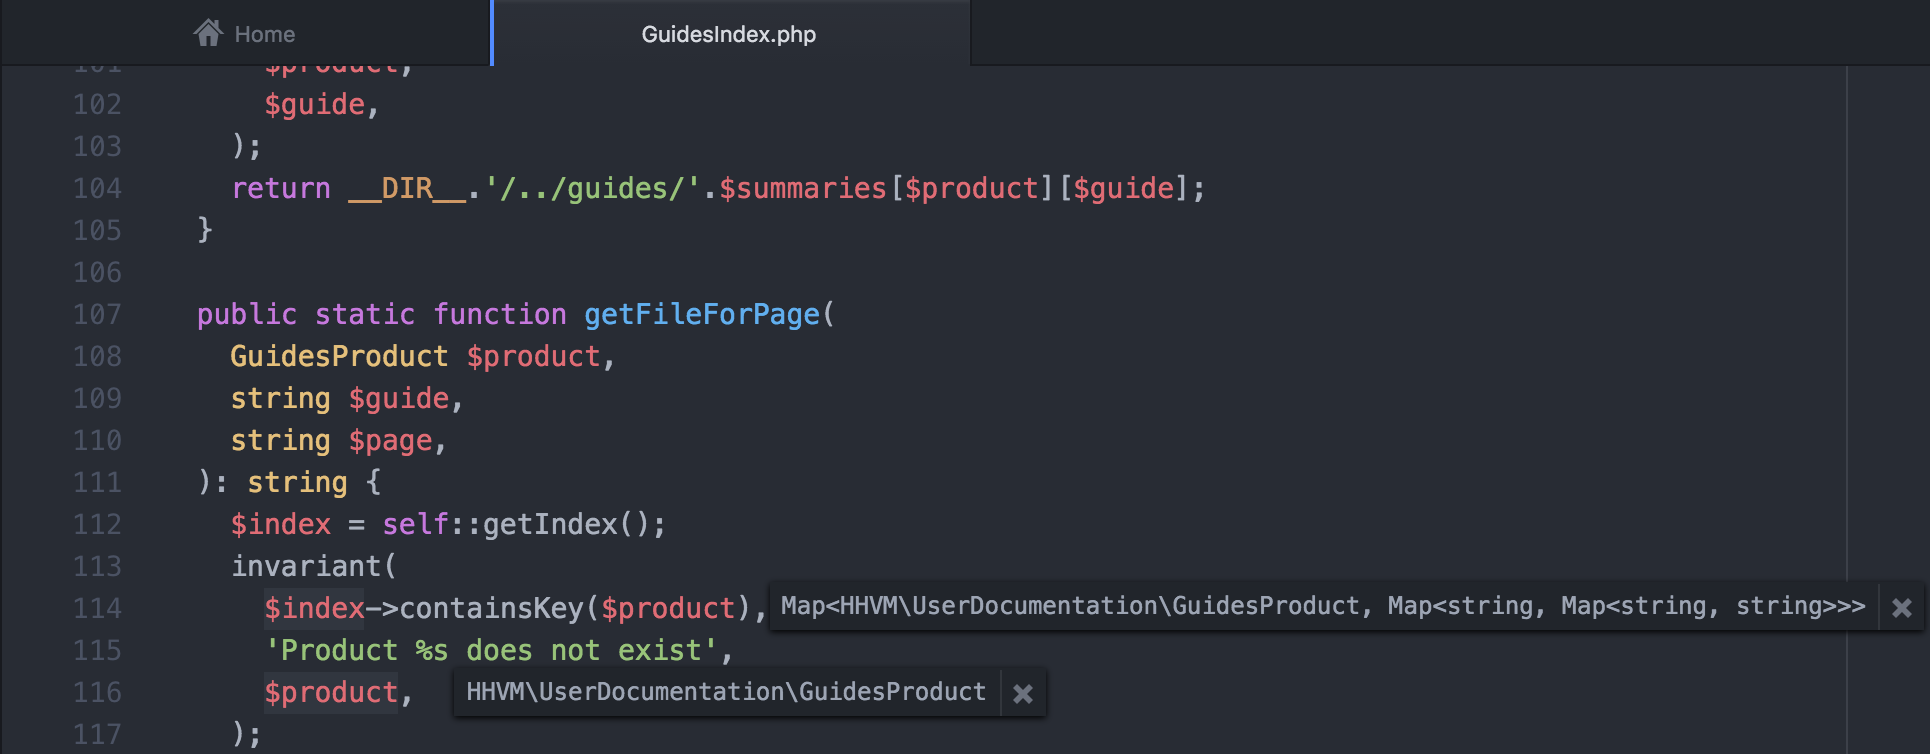
The highlighted variables show that their type variables have been pinned. If you hover over the type hint, its associated variable will have motion in its highlight.
Click the x icon of a pinned type hint to remove it.
Pinned type hints can be moved anywhere within the editor.
Type Coverage
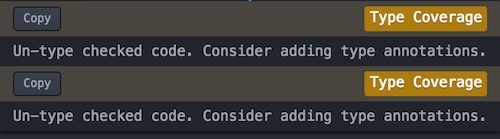
Nuclide can show you how much of your Hack file is covered by the type system with Type Coverage.

If the percentage is less than 100%, you can toggle the Type Coverage inline display to show you where the issues are.
From the Command Palette, choose Nuclide Type Coverage: Toggle Inline Display. You can also either press Ctrl-Option-Shift-V (Ctrl-Alt-Shift-V on Linux) or simply click on the percentage displayed in the Status Bar.
Hover over any sideways triangles that appear in the gutter to see the type check issue inline, or open the Diagnostics Table to see them all listed together. Clicking on any issue in the Diagnostics Table will highlight the associated line.
Code Formatting
Nuclide can take your Hack code and format it according to a built-in set of coding standards (e.g, two-space indents, bracket location, etc.).
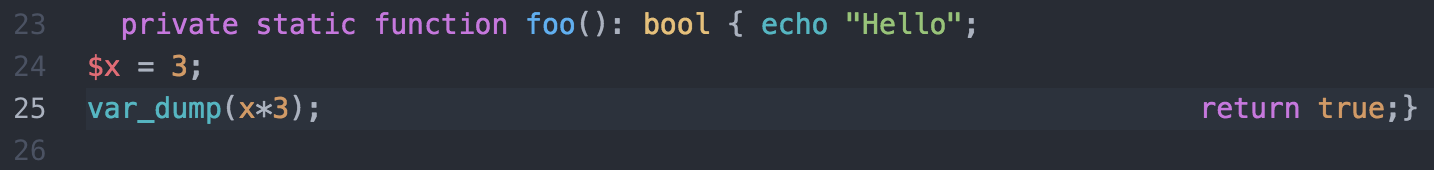
For example, here is a bit of code that looks relatively haphazard from a formatting perspective.
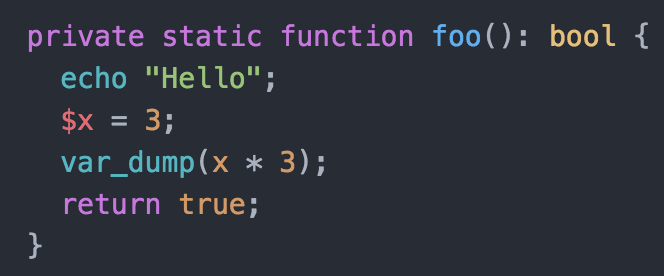
Place your cursor inside the function and press Cmd-Shift-C (Ctrl-Shift-C on Linux) to apply the coding standards to the function.
Debugging
Nuclide has support for debugging PHP and Hack projects. HHVM is recommended for debugging Hack and PHP code.
Theoretically, PHP debugging should work on other XDebug-compatible runtimes like Zend, but we have only tested this with HHVM.
Currently, we only support debugging remote projects.
Xdebug
In order for the Nuclide Debugger to attach properly to the HHVM process, you must enable Xdebug in your HHVM configuration.
Your remote server may already have the appropriate settings, if so, this step is not necessary.
You do this by specifying Xdebug configuration information
in a .ini file that will be passed to the HHVM executable. Here is an example xdebug.ini file that can
be used:
xdebug.enable = 1
xdebug.remote_enable = 1
xdebug.remote_autostart = 1
xdebug.overload_var_dump = 0
xdebug.remote_port = 9000
In the Nuclide Settings, there is an option to specify the remote port as well. If you specify the port in an
.inifile withxdebug.remote_port, make sure it matches what is in the Nuclide port setting found undernuclide-debugger-php.
Make sure the Arguments for your PHP runtime setting points to your .ini file.
Example
-c /root/docker-shared/code/xdebug.ini
The Path to your PHP runtime setting should indicate the location of HHVM on your server, such as /usr/bin/hhvm.
Debugging: HHVM Toolbar
The Task Runner toolbar is one way to debug Hack or PHP projects. To open the Task Runner toolbar, click on the Toggle Task Runner Toolbar button in the Nuclide toolbar or search for Nuclide Task Runner: Toggle HHVM Toolbar in the Command Palette.
See the Task Runner HHVM guide for instructions on debugging Hack or PHP projects.
Debugging: Command-Line
You can also debug directly from the command-line.
- Have a PHP or Hack file active in the Editing Area.
- Click on the Toggle Debugger icon in the Nuclide toolbar or press
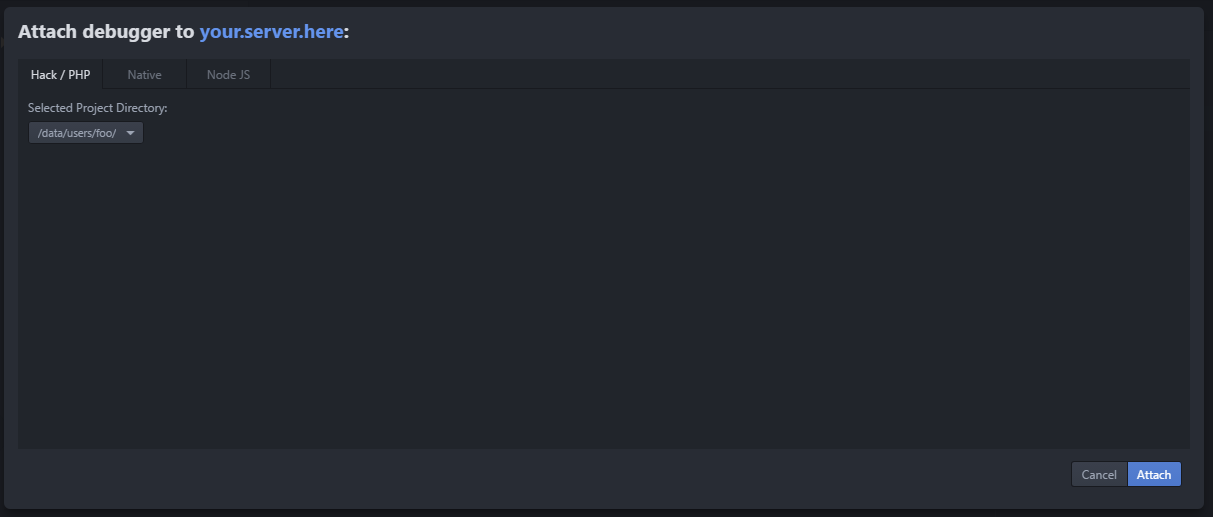
Cmd-Shift-A(Ctrl-Shift-Aon Linux or Windows) to bring up the Debugger Attach dialog. - The connection will default to the location of your current working root. If necessary, click the machine name to change to another connection.
- Select the PHP/Hack tab.
-
Click Attach.
- Set breakpoints in your code.
- Run your PHP/Hack script or server
- If you are running a script:
hhvm -c xdebug.ini your-script.php - If you are running a server:
hhvm -c xdebug.ini -m server
- If you are running a script:
- Start Debugging.
Note: If you are debugging a server, you will need to send a request to that server in order for the server breakpoint to be hit.
Console
While debugging, HHVM will send its stdout to the Console below the Editing Area. This also includes output from print() (or similar) statements and stack traces.
Evaluation
Basic evaluation in the REPL works out of the box.
You can also load bindings from your project so that you can interact with them in the console. To
do this, make sure there is a .hhconfig file checked in at the root of your project, as well as a
scripts/xdebug_includes.php file. The xdebug_includes.php file must contain at least one call to the
xdebug_break function. Here is an example of such a file:
<?hh

// This file is named 'xdebug_includes.php' and lives inside a directory named 'scripts/'.

// Put code here that loads context into the environment.  For example, you can use PHP's require to
// import function and variable bindings, which will then be available via the REPL.

xdebug_break(); // Pauses the runtime's execution when XDebug mode is enabled.
Now when you debug your Hack or PHP project, the Nuclide Debugger will also make a separate
connection to the runtime and launch this script. Any context loaded before calling
xdebug_break() will be accessible via the REPL.
Filtering
After you attach to a remote server with HHVM, the Debugger will utilize the first instance
of HHVM that is run with the correct .ini configuration, etc. If you are running multiple
instances of HHVM with that configuration, you might start debugging different code unintentionally.
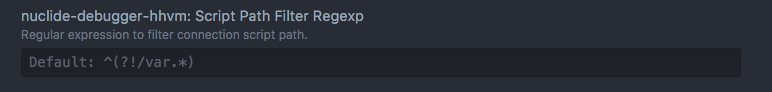
Nuclide provides a mechanism to filter out the proper, intended script. For example, if you know the script name that will be debugged, then use that as the filter.
Go to Settings | Packages | Nuclide | Settings and look for nuclide-debugger-hhvm: Script Path Filter Regexp.
Other Settings
There are other Hack and PHP debug settings that can be set as they pertain to HHVM. These include:
- Filtering debugging connections by user name (
idekey). By default, this is set to the user that started the HHVM process (you can override this withxdebug.idekeyin an.inifile). - HHVM logging level. The default is
INFO. - Debugging Port. The default is
9000. If you override this is in an.inifile, ensure that the Nuclide setting matches this setting.
Go to Settings | Packages | Nuclide | Settings and look for the nuclide-debugger-php settings.